
Ecommerce Analytics: How Sellers Can Use Sales Data to Grow Profitably
 September 5, 2026
 Yashwardhan Singh
 0 Comments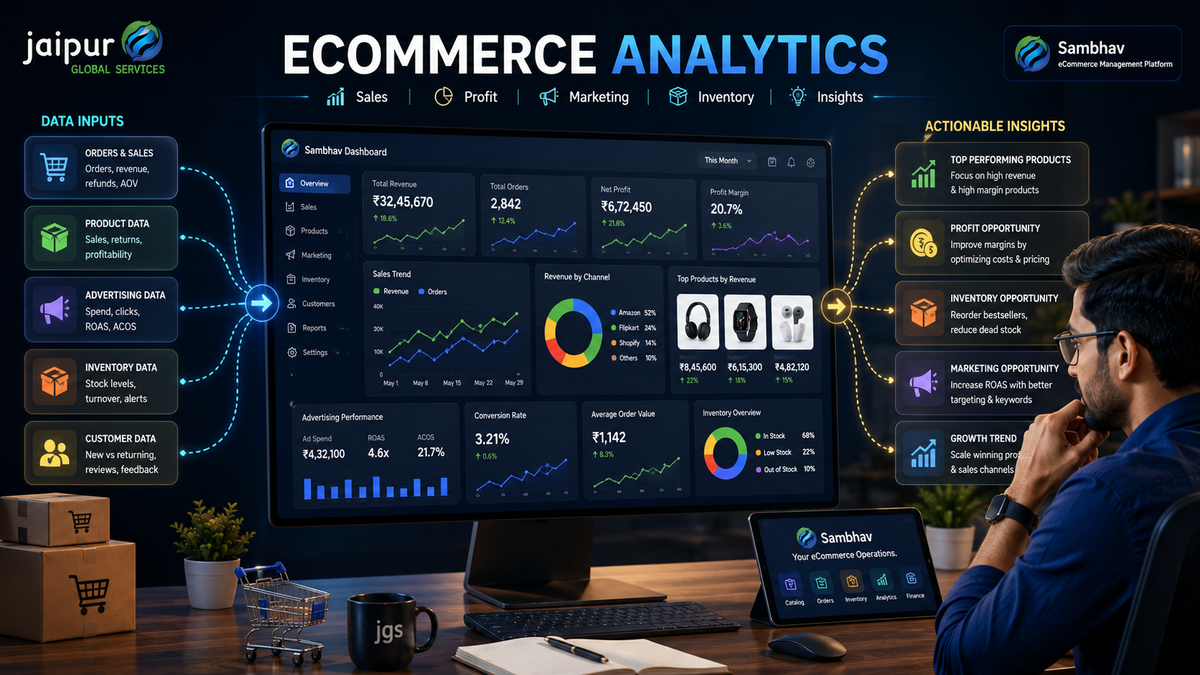
A seller closes the month with strong revenue and feels good about it — until the numbers get pulled apart. Advertising costs ate into margins on half the catalog. Marketplace fees and returns quietly offset a chunk of the top line. A handful of "bestsellers" turn out to be barely breaking even once fulfillment costs are counted. Revenue told one story; profitability told a different one.
This is exactly the gap ecommerce analytics closes. Sales numbers alone don't tell the complete story — analyzing sales, customer, product, marketing, and inventory data together helps sellers see where they're actually making money, not just where they're generating volume. None of this guarantees growth or profit on its own, but it replaces guesswork with evidence.
What Is Ecommerce Analytics?
Ecommerce analytics is the practice of collecting and analyzing data from across a business — sales, orders, products, customers, store activity, advertising, inventory, returns, marketplace performance, and revenue versus costs — to understand what's actually driving results. This falls under the broader umbrella of Ecommerce Data Analytics, covering everything from a simple sales spreadsheet to a full multichannel reporting system.
One distinction matters early: collecting data and using data are not the same thing. Plenty of sellers have sales reports, ad dashboards, and inventory spreadsheets sitting in different places — but if none of that changes a pricing decision, an ad budget, or a restocking call, it's just data sitting idle. Real analytics in e-commerce means turning numbers into decisions, not just numbers into charts.
Why Ecommerce Analytics Matters for Sellers
Analytics helps sellers understand sales trends over time, identify which products are genuinely profitable versus which just look busy, and spot weak performers before they drag down overall margins. It reveals customer behavior, supports better marketing decisions, and helps monitor inventory before stockouts or excess stock become costly. It also surfaces high-return products worth investigating, allows fair comparison across marketplaces, and — most importantly — replaces assumptions with evidence. None of this comes with guaranteed percentage improvements; the value is in decisions based on what the data shows rather than what seems likely.
Important Ecommerce Metrics Sellers Should Track
Sales & Revenue Metrics: revenue, number of orders, average order value, units sold, and sales growth over time.
Profitability Metrics: gross margin, net profit, contribution margin, cost of goods sold, marketplace fees, fulfillment costs, and advertising costs.
Customer Metrics: customer acquisition cost, repeat purchase rate, customer lifetime value, conversion rate, and customer retention.
Product Metrics: product-level sales, product-level profitability, return rate, inventory turnover, and which products are best-selling versus slow-moving.
Marketing Metrics: advertising spend, ROAS, CTR, conversion rate, and cost per acquisition.
Looking at any one of these in isolation is misleading. A high-revenue product with a high return rate and heavy ad spend might contribute far less to the bottom line than a quieter product with strong margins and low returns. The combination tells the real story revenue alone can't.
How to Perform Ecommerce Data Analysis
Step 1 — Collect data. Pull information from marketplaces, your store, advertising platforms, payment systems, and inventory tools.
Step 2 — Clean and organize it. Consistent product names, SKUs, dates, and cost data across sources — inconsistent labeling is one of the fastest ways to get misleading results.
Step 3 — Segment the data. Break it down by product, category, marketplace, location, customer type, time period, or campaign, since aggregate numbers often hide what's actually happening.
Step 4 — Identify trends. Look for sales increases or decreases, seasonal patterns, shifting demand, advertising performance changes, return trends, and emerging inventory problems.
Step 5 — Turn insights into action. The goal isn't producing a report — it's making a pricing change, adjusting an ad budget, reordering stock, or fixing a listing based on what the data shows.
How Ecommerce Analytics Can Improve Product Decisions
Data helps answer questions gut feeling often gets wrong: which products deserve more investment, which have weak margins despite decent sales, which carry high return rates worth investigating, which should be promoted more, which need listing improvements, which are due for a pricing review, and which need inventory adjustments.
The key distinction is between a product that sells a lot and one that actually contributes to profitability. A best-seller with thin margins, high returns, and heavy ad dependency can be less valuable than a modest performer with strong contribution margin — a difference invisible until the product-level data is reviewed.
Using Ecommerce Marketing Analytics to Improve Advertising
Ecommerce marketing analytics means comparing advertising spend against sales generated, ROAS, conversion rate, CTR, cost per acquisition, and product-level performance — not just glancing at total ad revenue.
It's worth looking beyond ad revenue to product margins, returns, and marketplace fees when judging whether a campaign is working. A campaign can show an impressive ROAS while generating little real profit, if the products advertised carry thin margins or high return rates. High ROAS does not automatically mean high profit — it's one input, not the full picture.
Using Analytics for Inventory and Pricing Decisions
Inventory: analytics helps identify fast-moving products worth prioritizing, flag slow-moving inventory tying up capital, monitor demand patterns for better replenishment, and reduce avoidable stockouts and excess stock.
Pricing: data can show how sales change after a price adjustment, how a product performs at different price points, and how discounts actually affect profitability rather than just driving volume. Where reliable competitor pricing data is available, it can also inform where a product sits in the market.
Pricing analytics, in most seller setups, supports decision-making rather than making decisions automatically — treat it as an input to a human decision unless the specific technology in place genuinely operates as an automated pricing system.
Digital Commerce Analytics Across Multiple Channels
Digital commerce analytics becomes noticeably harder once a seller operates across Amazon, Flipkart, Walmart, Shopify, and other channels — data ends up scattered across separate dashboards, each with its own format and update schedule.
A centralized view of sales, orders, products, advertising, inventory, customers, returns, and financial performance makes cross-channel comparison meaningfully easier. Without it, sellers often compare channels on gut feel rather than consistent data — making it harder to tell which channel actually deserves more investment.
What Is Ecommerce Data Analytics Software?
Ecommerce data analytics software typically centralizes dashboards, sales reporting, product-level analytics, marketplace performance tracking, advertising analytics, inventory insights, customer analytics, financial information, custom reporting, and trend identification in one place, rather than requiring sellers to check five separate systems.
The right software depends heavily on business size, which marketplaces are in use, how many data sources need connecting, and specific operational requirements — a small single-channel seller and a multi-marketplace brand with hundreds of SKUs have very different needs, and no single tool is automatically right for both.
How JGS (Jaipur Global Services) Helps Ecommerce Sellers Become More Data-Driven
JGS (Jaipur Global Services) works with ecommerce sellers and brands on marketplace and ecommerce operations, helping bring together catalog management, account management, and advertising with the analytics needed to make informed decisions — without claiming that support guarantees specific profitability, rankings, sales, or ROAS outcomes, which depend on many factors beyond any single service.
How Sambhav Helps Sellers Manage Ecommerce Data and Operations
Sambhav, JGS (Jaipur Global Services) in-house SaaS platform, brings important ecommerce workflows and information into one centralized environment — catalog management, advertising management, growth analytics, CRM, operations management, finance and reconciliation, and market intelligence, rather than scattered across separate dashboards and spreadsheets.
A centralized platform gives sellers better visibility into their operations, supporting a simple loop: sales data → performance analysis → identify opportunities → take action → monitor results. Sambhav doesn't automatically guarantee profitable growth — no software can — but it supports the kind of consistent, connected data review this article has described throughout. If your sales, advertising, and inventory data currently live in five different places, that's worth exploring further.
Common Ecommerce Analytics Mistakes
Sellers commonly focus only on revenue while ignoring product-level profitability, or look at data without acting on it — a report nobody uses has no value. Tracking too many unnecessary metrics dilutes focus, while inconsistent data (mismatched SKUs, different date ranges) leads to misleading conclusions. Ignoring returns and cancellations paints too rosy a picture, and evaluating advertising without considering margins can make an unprofitable campaign look like a win. Not comparing marketplaces side by side, deciding from very short-term data, and keeping data scattered across disconnected systems round out the most common pitfalls.
Simple Ecommerce Analytics Framework
Collect → Organize → Analyze → Identify → Act → Measure
Collect data from every relevant source — marketplaces, store, ads, payments, inventory. Organize it consistently so comparisons are reliable. Analyze it by product, channel, and time period rather than in aggregate. Identify the trends and gaps that matter most to profitability. Act on what the data actually shows, rather than sitting on the report. Measure whether that action actually moved the numbers, and adjust from there.
FAQs
1. What is ecommerce analytics?
The practice of collecting and analyzing sales, customer, product, marketing, and inventory data to understand what's actually driving a business's results and make better decisions.
2. Why is ecommerce data analysis important?
Because revenue alone can hide weak profitability — analyzing costs, returns, and margins alongside sales shows what's genuinely working versus what only looks successful on the surface.
3. Which ecommerce metrics should sellers track?
A combination across sales, profitability, customer, product, and marketing categories — no single metric, including revenue, tells the full story on its own.
4. What is ecommerce marketing analytics?
Comparing advertising spend against sales, ROAS, conversion rate, and cost per acquisition — while also factoring in product margins and fees, since high ad performance doesn't always mean high profit.
5. How can ecommerce analytics software help sellers?
By centralizing data from multiple marketplaces and tools into one place, making trend identification, product comparison, and decision-making considerably faster than checking each system separately.
6. Can ecommerce analytics help improve profitability?
It can help sellers identify where money is actually being made or lost across products, channels, and campaigns — but the improvement comes from acting on those insights, not from the analytics itself.
Conclusion
Ecommerce analytics isn't really about dashboards or tracking sales numbers for their own sake. The real value comes from turning that data into decisions — about products, pricing, advertising, inventory, customers, marketplace performance, and ultimately profitability.
Revenue tells you what happened. Analytics, applied properly, tells you why — and what to do next. JGS (Jaipur Global Services) helps sellers manage the marketplace operations that these decisions touch, while Sambhav offers a more centralized way to bring sales, advertising, catalog, and operational data together, making that "collect to act" loop considerably easier to run consistently. If your ecommerce data currently feels scattered across too many places, it's worth exploring what a more connected setup could look like.